Notion CRM with Live Google Sheets Dashboards (2026)
Most Notion CRMs hit the same wall. The pipeline works fine. The contact records work fine. But the moment someone asks "what's our pipeline by stage by rep this quarter?", you're stuck. Notion's formula property is single-page-scoped. There's no native pivot. You end up screenshotting filtered views into Slack.
The fix isn't to abandon Notion. It's to keep Notion as the working surface and let Google Sheets do the dashboarding, with real-time 2-way sync between them.
This post walks through how to build a Notion CRM whose dashboards live in Sheets and render back in Notion. You'll see exactly which columns to set Notion-to-Sheets, which to set Sheets-to-Notion, and how to embed the resulting pivot tables and charts back into your Notion CRM page.
The setup at a glance
You'll have three layers:
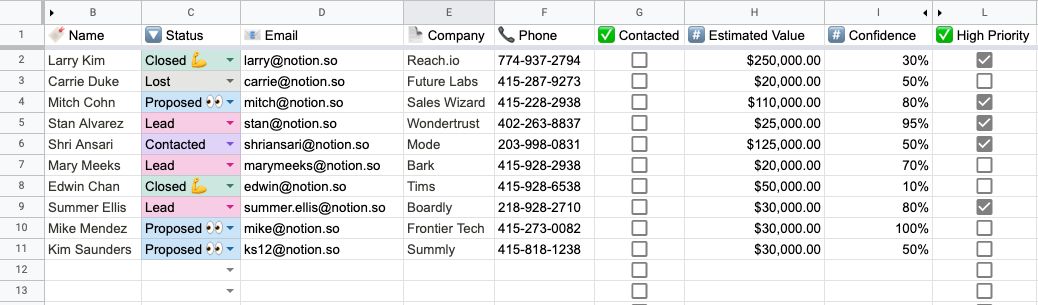
- A Notion database with your deals (Name, Stage, Value, Owner, Source, Expected Close Date, etc.). The team works here.
- A synced Google Sheet mirroring the database in real time. Pivot tables and charts live here.
- Notion blocks embedded back in the CRM dashboard page that display the pivot and chart, updating as deals move.
Setup is 15-20 minutes the first time. After that it runs forever.
Step 1: Set up the Notion CRM database
If you already have a Notion CRM, skip this. Otherwise, create a database with at minimum:
- Name (Title): the deal name
- Stage (Status): Lead, Qualified, Proposal, Negotiation, Closed Won, Closed Lost
- Value (Number, formatted as currency): deal size in dollars
- Owner (Person): assigned rep
- Source (Select): where the deal came from (Inbound, Outbound, Partner, Event, etc.)
- Expected Close Date (Date)
- Actual Close Date (Date): populated when closed
You can use one of Notion's CRM templates as a starting point. The exact shape doesn't matter, but having Stage, Value, Owner, and Source is what makes the Sheets pivots useful.
Step 2: Sync the database to Google Sheets with Sync2Sheets
Install Sync2Sheets if you haven't already. In any Google Sheet, open the Sync2Sheets sidebar from the Extensions menu, connect your Notion workspace, and pick the CRM database.
When the first-sync card shows the per-column direction picker, the right defaults for a CRM are:
- Stage, Value, Owner, Source, Expected Close Date, Actual Close Date → leave on Notion to Sheets. The team updates these in Notion; Sheets reads them.
- Name → Both ways. Lets the team edit deal names from either tool.
- Anything you want to compute in Sheets and push back (more on this below) → Sheets to Notion.
The initial sync runs in seconds. From that point on, any Notion edit shows up in Sheets within seconds, and vice versa.
Step 3: Build the pivot in Sheets
In a new tab in the same spreadsheet:
- Insert → Pivot table → use the full synced range as the source.
- Drag Stage to Rows.
- Drag Owner to Columns.
- Drag Value to Values, set to SUM.
- Optionally filter by Actual Close Date for "this quarter".
You now have a live pipeline-by-stage-by-rep matrix that recalculates whenever someone moves a deal in Notion.
For a revenue-by-source breakdown, build a second pivot:
- Rows: Source
- Values: COUNT of deals + SUM of Value
- Filter: Stage = Closed Won, Actual Close Date in current quarter
Step 4: Build a chart from the pivot
Highlight the pivot table → Insert → Chart. A stacked bar (Stages on X, Value on Y, segmented by Owner) is usually the most readable for pipeline visualizations.
Customize the colors to match Notion's palette if you care about visual consistency. Sheets remembers your styling and applies it the next time.
Step 5: Embed the dashboard back into Notion
This is where 2-way sync changes the game. You have two options:
Option A: Table blocks (for the pivot)
Sync2Sheets' table blocks feature pushes a Sheets range into a Notion simple table. Open the Sync2Sheets sidebar, go to Table Blocks, paste the link to your Notion CRM dashboard page, and select the pivot range as a named range.
The pivot table now renders inside your Notion page as a simple table. When deals move, the table updates on your plan's schedule (every 2 hours on Starter, 30 minutes on Advanced, 15 minutes on Business).
Option B: Block updates (for headline metrics)
For top-of-page KPIs like "Pipeline this quarter: $1.2M", use block updates. Create a named cell in Sheets that sums the pipeline (=SUMIF(Stage_column, "Closed Won", Value_column)), then link a Notion heading or callout block to that cell.
Most CRM dashboards have a few headline numbers at the top (Pipeline, Closed Won, Avg Deal Size, Win Rate) and the detail breakdown below. Block updates handle the headline metrics; table blocks handle the breakdown.
Step 6: Add Sheets-driven enrichment (optional)
This is where Sheets-to-Notion direction columns earn their keep. Examples:
- Lead score. Add a "Lead Score" column to your Notion database. Set it to Sheets to Notion. In Sheets, calculate the score with a formula combining deal value, source, time in pipeline, etc. The result lands in Notion.
- Days in stage. Set a "Days in Stage" column to Sheets to Notion. In Sheets:
=TODAY() - StageEnteredDate. Notion now shows freshness without needing a Notion formula. - Forecasted close. Set a "Forecast" column to Sheets to Notion. Compute the forecast in Sheets using weighted-probability formulas (
=Value * IFS(Stage="Lead", 0.1, Stage="Qualified", 0.3, ...)).
The team works in Notion, sees the calculated values as if they were native Notion properties, and the math stays in Sheets where it belongs.
What this gives you vs alternatives
You could also: run the CRM in Airtable (more native pivots, less docs-friendly), use HubSpot or Pipedrive (proper CRMs, but you leave Notion), or build dashboards in Looker Studio (heavier setup). The Notion + Sync2Sheets approach is the lightest if you're already in Notion. See Notion vs Airtable for the deeper comparison.
Five things about the data shape that trip people up
The Page ID column is load-bearing. Don't delete it. Sync2Sheets uses it to map each row back to its Notion page, and removing it breaks the sync for that sheet.
Notion select and status colors come through to Sheets via data validation plus conditional formatting, so your pivot can group by Stage and visually match the Notion view without extra styling work.
Date ranges (the kind Notion lets you set with a start and end) split into two Sheets columns automatically. Useful for SUMIFS with date filters, slightly weird the first time you see it.
Read-only Notion types are always one-way to Sheets. Formulas, rollups, created time, last edited time, unique ID, button, verification, files. You can't push back to them, period. (Full type support list.)
Rollups carry over with their computed value. If your Notion CRM uses rollups to total deal value across linked tables, those values land in Sheets and pivot on them just fine.
Worth knowing before you start
Most teams I talk to set this up in one afternoon and then never touch it again. The hardest part isn't the sync, it's deciding which columns should be calculated in Sheets versus owned in Notion. Sketch that on paper before opening the sidebar. Five minutes upfront saves an hour of flip-flopping.
If you want a head start, the Notion CRM templates roundup has a few good starting databases, or grab the full 2-way sync guide for the broader picture before committing. Install Sync2Sheets when you're ready (7-day free trial, no card).
Sync Notion to Google Sheets in real time
Use Sheets formulas in Notion, build dashboards, back up your databases, and compare tools. Free 7-day trial.