How to Make a Notion Investment Portfolio Synced with Google Sheets [Free Template]
![How to Make a Notion Investment Portfolio Synced with Google Sheets [Free Template]](/images/blog/notion-portfolio-assets.png)
Tracking investments in Notion is straightforward until you realize Notion has no live stock price, no formula that can fetch one, and no way to chart historical data.
Google Sheets has all three, via GOOGLEFINANCE, formulas, and built-in charts. Sync the two, and your Notion portfolio just works: live prices, auto-updating totals, charts embedded back in. Here's the setup with Sync2Sheets.
Tools We'll Be Using
Sync Your Notion Stock Portfolio with Google Sheets in 7 Steps
Duplicate the template
To start, duplicate the free Stock Template into your Notion account.
Install Sync2Sheets
Install Sync2Sheets and connect the workspace that contains the template you just duplicated. Remember to select the corresponding Notion page when giving permissions.
For step-by-step details, take a look at the following YouTube video:
Sync the Assets database
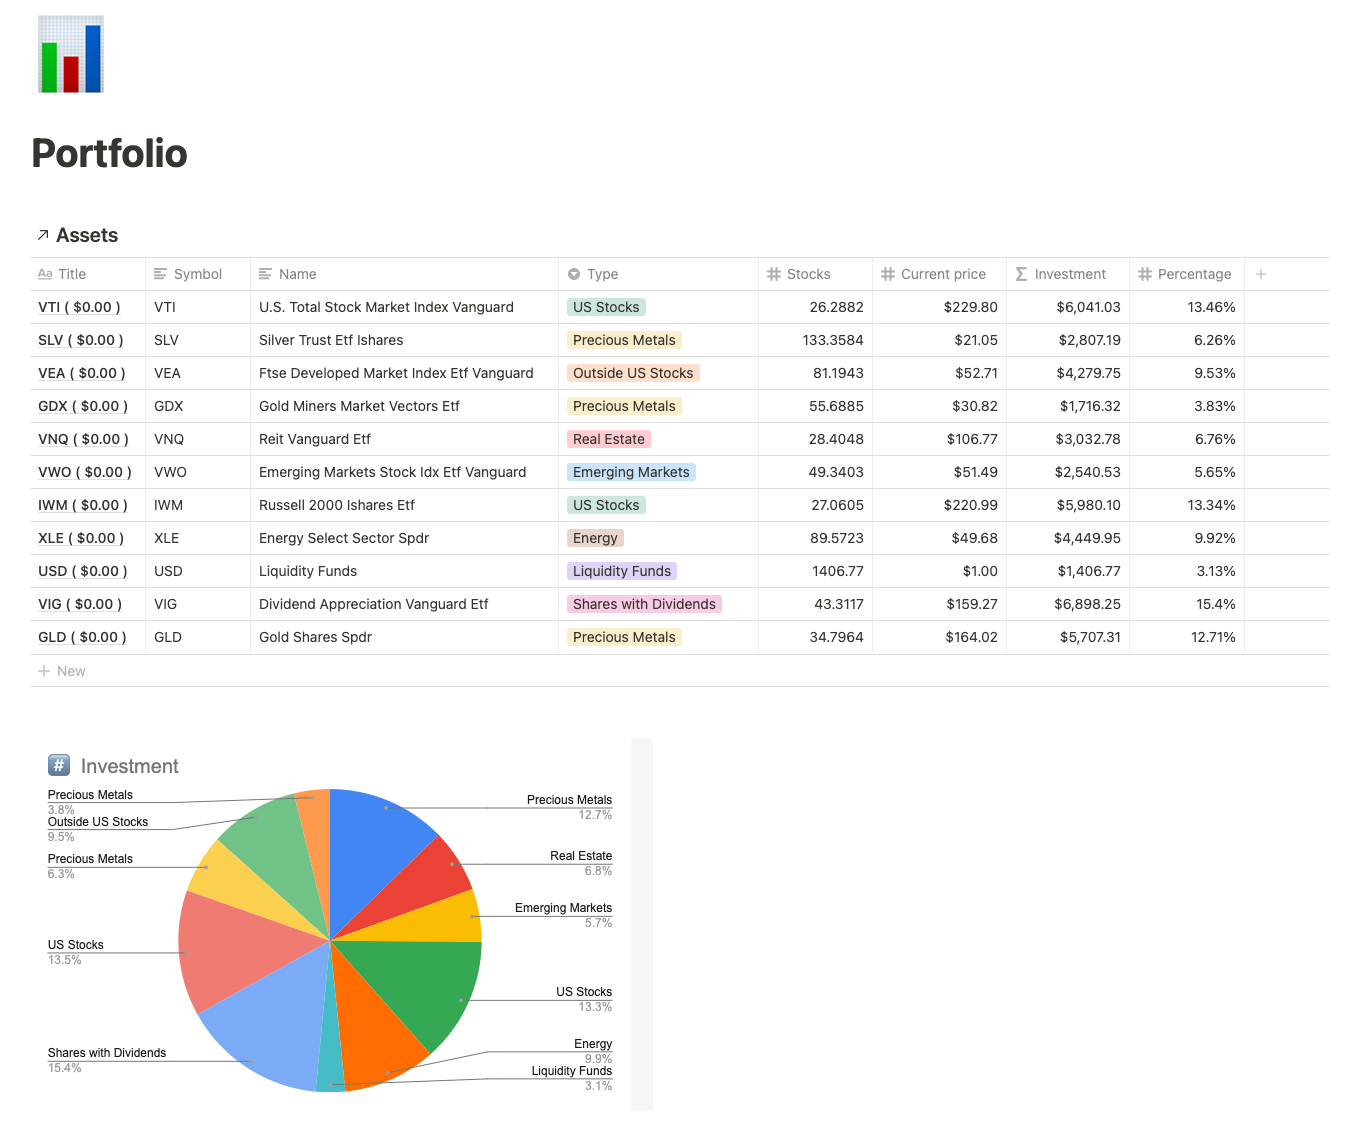
Once you have your workspace connected with Google Sheets and the template in your account, it's time to sync the database. You should end up with a sheet that looks like this:
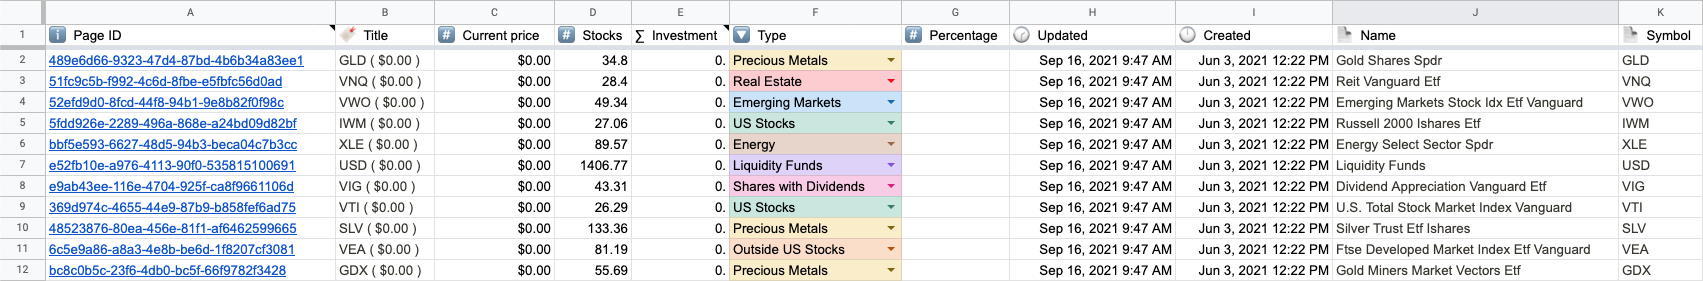
We can hide and move columns if we want, and the sync process will still work since each column is uniquely identified. You can also change the names of the headers if you like. Now we can clean up the table, hiding Created, Updated, and Page ID as well as reordering the columns.
Using GOOGLEFINANCE formula
Now that we have the table in sync with Notion, records will be updated every 15 minutes. You can also update them manually when you want. Having the data available in Google Sheets will allow us to do two nice things: create charts and add information like the current price and the percentage of each investment in our overall portfolio.
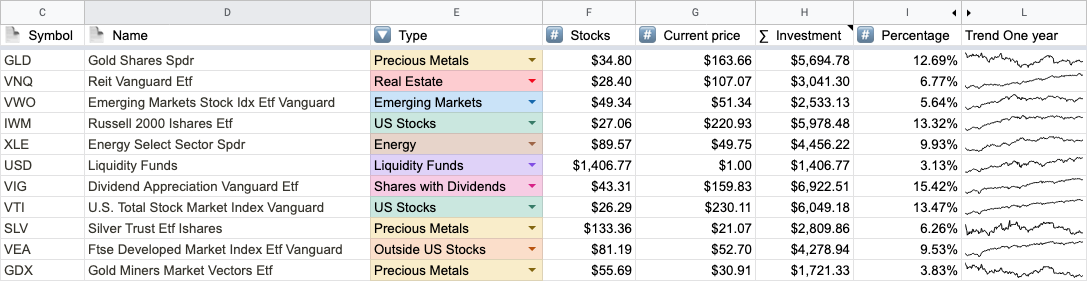
The first thing we'll do is add a new column, One Year Trend. We will use two handy formulas that are available in Sheets, =GOOGLEFINANCE() and =SPARKLINE() and =SPARKLINE(). We'll use the former to fill the Current Price column and the latter to show a trend line in One Year Trend. I have added links to the documentation for each if you want to take a look.
In the One Year Trend column we will plot a sparkline showing the last year of pricing information for each asset. The formula looks like this: =SPARKLINE(GOOGLEFINANCE(C2, "price", TODAY() -365, TODAY())). C2 in this case is the Symbol column; replace it with the corresponding column in your spreadsheet.
We'll use this formula to display the asset's current market price in the Current Price column: =GOOGLEFINANCE(C2, "price").
We will also go ahead and calculate the percentage of each stock for the portfolio with =H2 / SUM($H$2:$H$12). Investment is a formula property defined in our Notion stock template. But for now, we will manually calculate the investment percentage to avoid dividing by 0: =F2*G2.
Setting the direction to Sheets to Notion
We want the values of the Current Price and Percentage columns to flow from Sheets into Notion. To make this happen we'll use Sync2Sheets' per-column direction picker and set both columns to Sheets to Notion. Take a look at this short video to see how it works:
Read this next: How to Set Dynamic Page Titles in Notion
Creating a chart
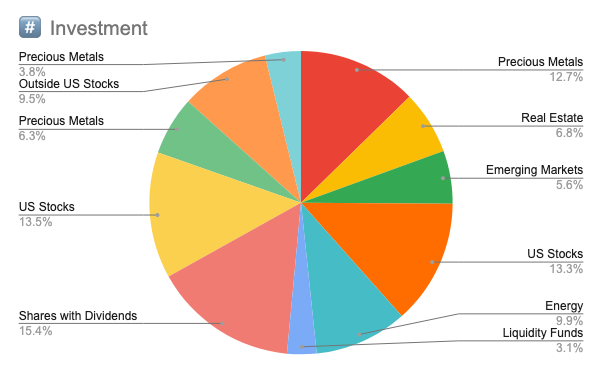
With our database in sync, we'll create a pie chart to show the type distribution of our assets.
Select the Type and Percentage columns and then go to Insert > Chart. For this example, we will create a pie chart, so in the right sidebar change the type to Pie chart. You can add a title and modify the options as you prefer.
Embedding the chart in Notion
Now we will embed the chart in Notion using an Embed block.
In Sheets, go to File > Publish to web. A modal will appear with the option to select a link or an embed. Select Embed and the chart that we previously created from the options. Then, copy the code.
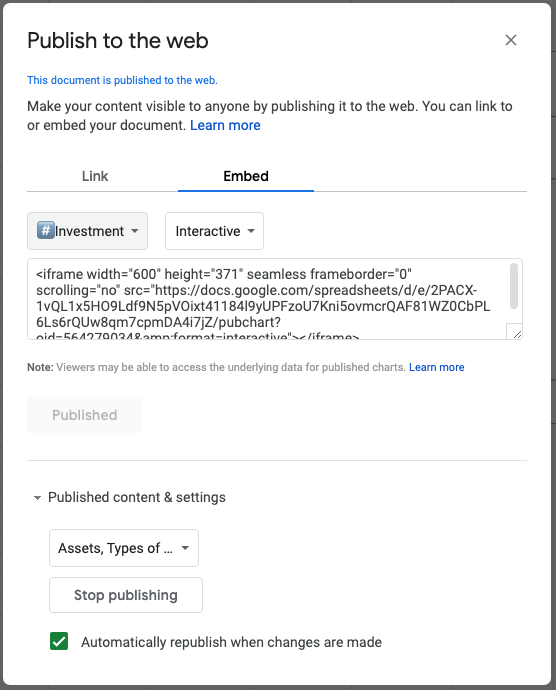
Back in Notion, add an Embed block and paste the code. You should now be able to see the interactive chart! Notion updates the content every time you open the page, and Google Sheets updates it every 5 minutes.
Conclusion
We covered a lot of material today! We learned how to sync a Notion database with Google Sheets, use formulas to display additional information for each asset, create a chart, and add both back into Notion with the help of the publishing feature of Google Sheets and the Embed block in Notion.
Can you think of any other situations where this setup could be useful? We would love to hear from you on X!
Sync Notion to Google Sheets in real time
Use Sheets formulas in Notion, build dashboards, back up your databases, and compare tools. Free 7-day trial.